
Data Science Applied Modeling
May 2021 Showcase
EDA | Modeling | Visualization | Conclusions | Further Reading
Overview
Objective
Utilize electronics e-commerce review data and create a prediction model of electronic product review ratings.
Purpose
Provide feature importance insights, caveats, and recommendations to optimize e-commerce efforts.

Exploratory Data Analysis
EDA | Modeling | Visualization | Conclusions | Further Reading
Data Exploration
After importing the raw data we'll run a few functions and the profile report to generate a thorough and cross-feature comparison of the data. Additionally, the use of the profile report provides quick data visualization for further context.
Questions to keep in mind while we explore the data:
Is the data legible to readers?
Are all variables in the type we'd expect?
What cardinality might be present?
Where are any null values? What can we ascertain created them? And how do we need to adjust for that?
Are columns redundant, applicable, or helpful to our primary data objective?
Of these answers, what should be fixed, dropped, or engineered?
Click an image below for a closer view.
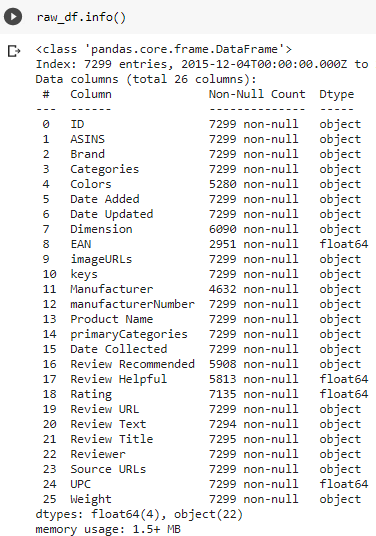
The simple .info function provides a good first view. Here we notice unfamiliar terminology, potential duplicates, sporadic nulls, and date columns in object format.
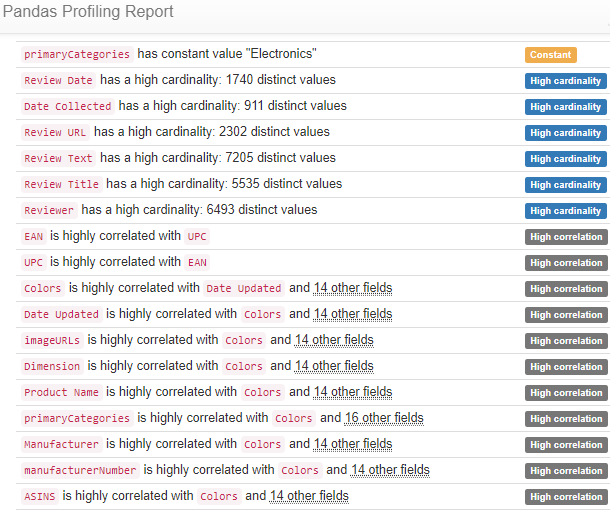
From this view of the Profile Report at first we see a concerning amount of cardinality and correlation. With context we can quell some concerns. Reviewing the high cardinality features we can confirm this outcome was expected. The data input for these fields is primarily open text fields. Reviewing the high correlation features we can also overlook.
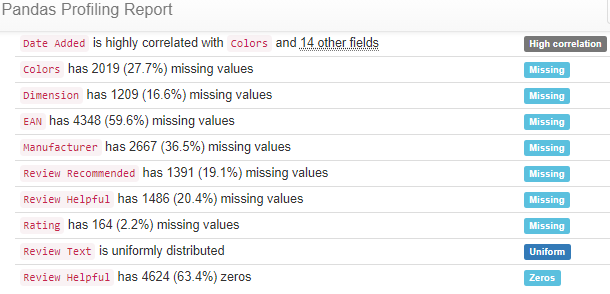
From this view of the Profile Report at first, we see a concerning amount of missing values. With context, we see this is near the expected and desired outcome. The data input for these fields is optional. Leaving the data be will allow for a true representation of this feature in later modeling.
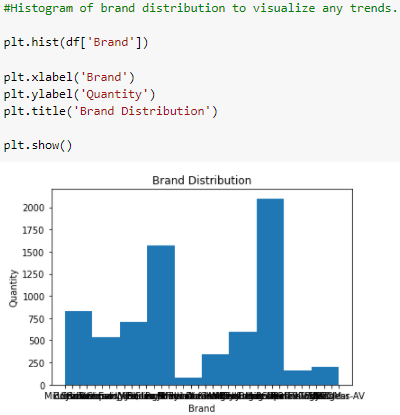
Applying a histogram to view the Brand column. Via the profile report, we discovered the manufacturer feature had a concerning amount of missing values. Instinctively this feature could prove pertinent to modeling needs. In search of a suitable alternative, it looks like the brand feature can be used. From a customer perspective, this may make more sense as a single manufacturer can own multiple brands without the end-user knowing the business connection.
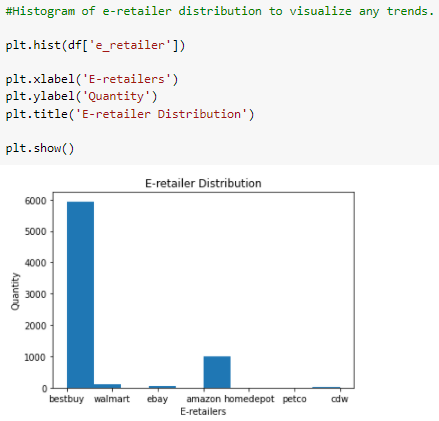
Applying a histogram to view the Brand column. Via the profile report, we discovered the manufacturer feature had a concerning amount of missing values. Instinctively this feature could prove pertinent to modeling needs. In search of a suitable alternative, it looks like the brand feature can be used. From a customer perspective, this may make more sense as a single manufacturer can own multiple brands without the end-user knowing the business connection.
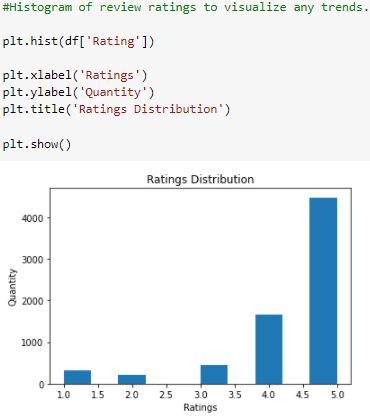
Applying a histogram to view the Rating column. As the target for this project, we'll use Rating category quantities to establish a baseline accuracy score. Given the strong skew of this feature, we'll further investigate feature importance to understand drivers of this trend.
Feature Engineering
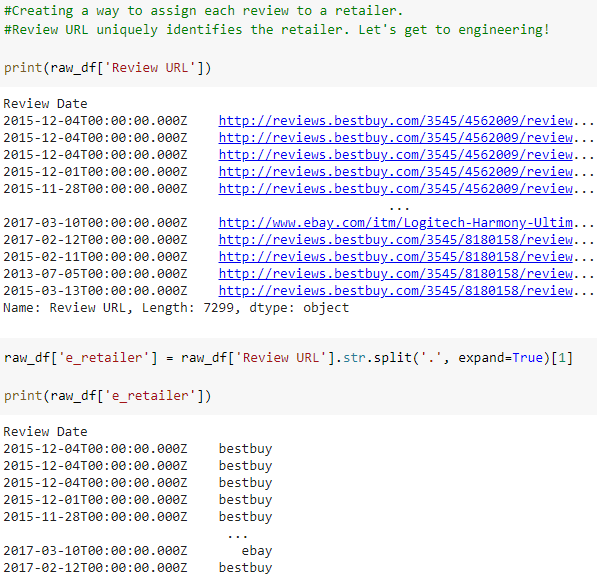
After reviewing the data and applying customer purchasing behavior a few new features come to mind for engineering. First, the name of the retailer is not readily available. Second, what if we converted each text column to numeric? This could provide the model additional numeric data to work with.
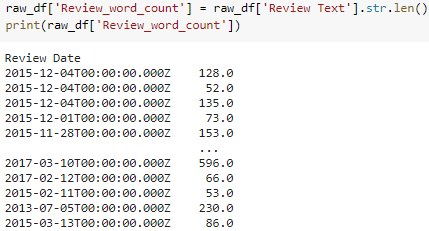
Later feature engineering could include character counts per title, review, and product feature; length in years the post has been online, and month the review was posted. To account for seasonal buying periods, indicating the month of review could prove useful for predictions.
Click an image below for a closer view.
Data Review
After our review of the data let’s revisit the original questions. With these in mind, we can create the necessary formulas, create a data wrangle function and start to model the data and start predicting our target.
Is the data legible to readers?
Most data is legible. Feature titles can be grammatically corrected. An e-retailer feature can be engineered. A lot of noisy data could be dropped. Some data columns have multiple entries. Upon further investigation it appears this data is not needed anyway.
Are all variables in the type we'd expect?
Primarily. Dates can stay in object form for now. Floats can stay for later computational purposes.
What cardinality might be present?
Cardinality is high primarily in free-form text data fields. This is expected and encouraged for the time of information requested. All high cardinality produced by the Profile Report was expected and confirmed.
Where are any null values? What can we ascertain created them? And how do we need to adjust for that?
Are columns redundant, applicable, or helpful to our primary data objective?
Of these answers, what should be fixed, dropped, or engineered?
Clean Data
After exploring, cleaning, and engineering it is time to get to work and clean that data.
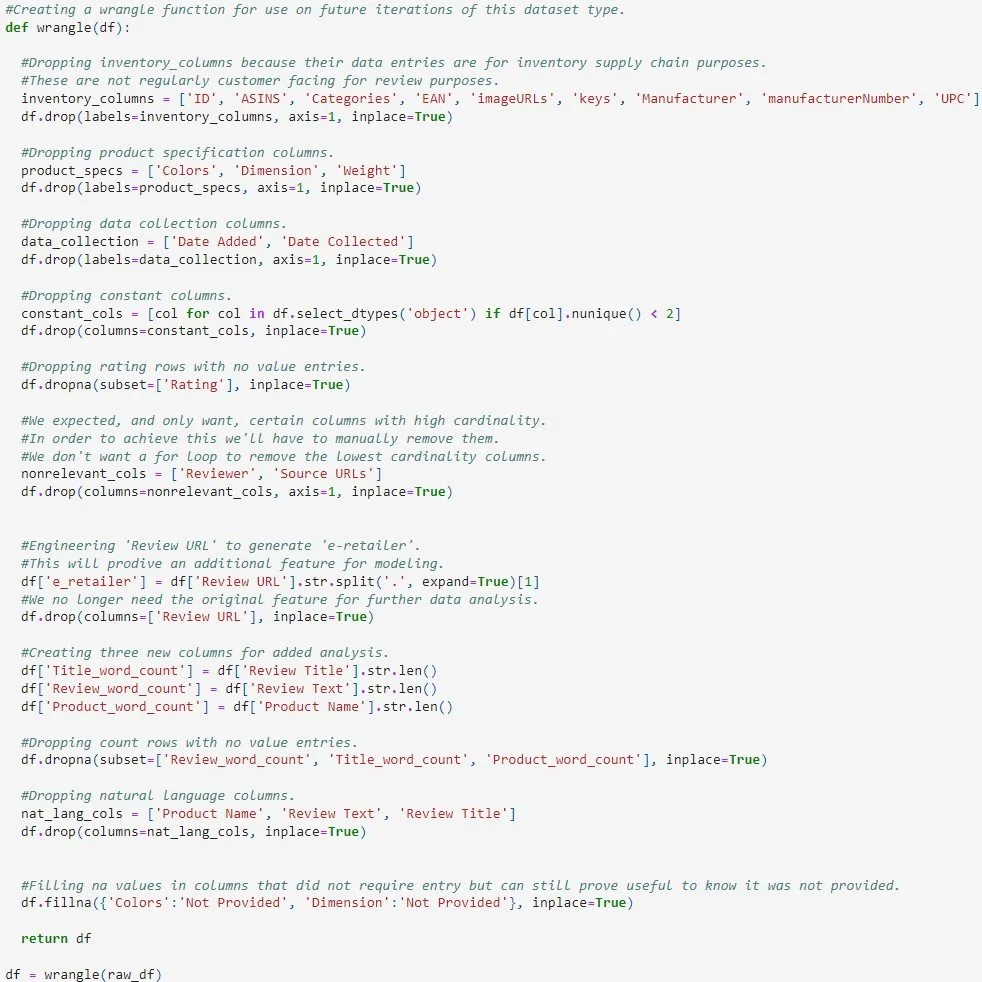
Final Wrangle Function
After exploring, cleaning, and engineering it is time to get to work and apply it to our data set.
The review of our EDA provided us with a few formulas and features to implement.
Dropping supply chain and product specification data
Engineering word count features
Dropping noisy data, such as constants and distinct identifiers
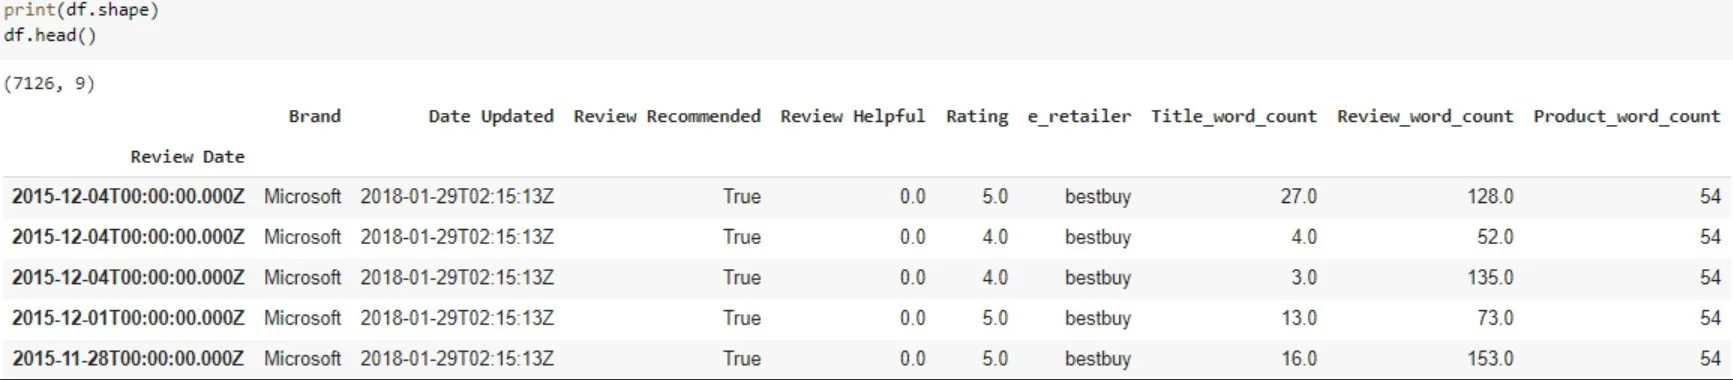
Final Data Frame
Now, that’s a clean-looking data frame!

Modeling
EDA | Modeling | Visualization | Conclusions | Further Reading
Methodology
In this project, we are creating supervised machine learning models to best predict electronic products’ review rating. This immediately tells us two things. First, the target vector is review rating. Second, the data is categorical because ratings are finite options, not continuous data.

Data Splitting
Establishing the metrix and vector to target the Rating feature. With .shape we see they are the correct dimensions. Additionally, with a simple formula we produce a boolean value to provide a quicker humanistic visualization of the same findings.
Shown here, the testing size was established at 25%. This slight increase above the 80/20 split was done to counter the highly skewed review rating data.
Baseline Accuracy Score
Now, that’s a clean-looking base!

Model Testing
Four modeling methods, scaling and encoding were tested to discern the best fit for this dataset. We’ll briefly discuss the primary three. Then continue the analysis in the visualization section with the final model.
Logistic Regression
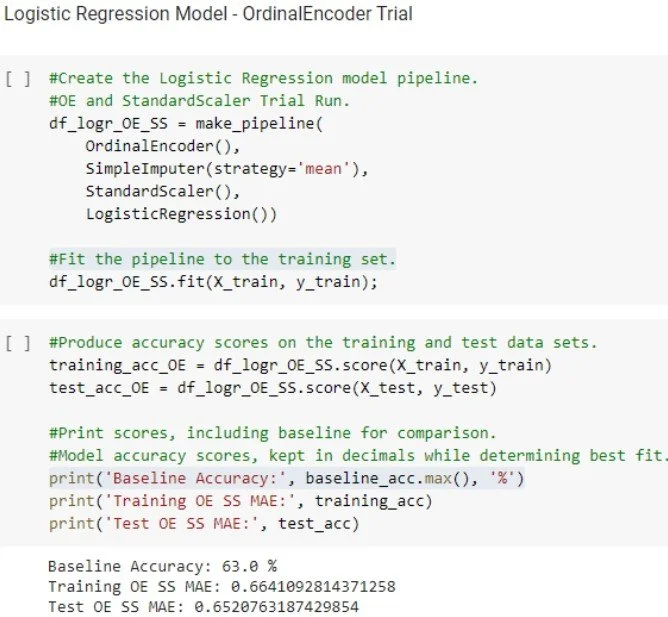
The only linear model to be tested logistic regression proved the true testing ground of the use of scaling and encoding options. While Logistic Regression typically favors two option answers, it may have worked here because the large majority of ratings fell within two categories. Looking forward, could this backward use prove helpful or hurtful?
Random Forest
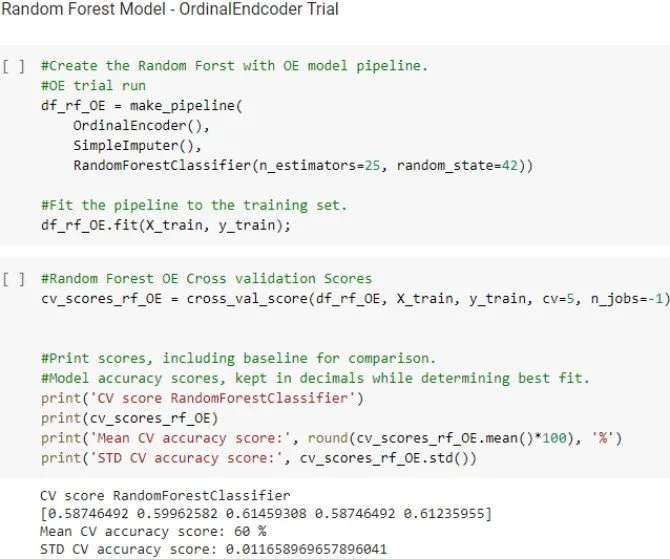
The random forest model did the poorest of the group. It was the only one to underperform the baseline.
However, the use of the Random Forest Model provided further validation that ordinal encoding was the best option for this data.
Boosting
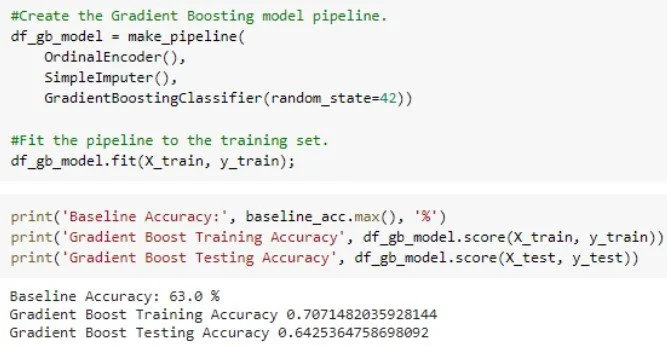
With the largest training accuracy and above baseline testing accuracy gradient boosting proves a strong modeling candidate. With additional model testing and visualization gradient boosting is the recommended model.

Visualization
EDA | Modeling | Visualization | Conclusions | Further Reading
Graphing
Of the original models, the three highlighted above were chosen to advance with visual analysis. From there gradient boosting proved the clear best fit for this data and the target variable.
Feature Importance
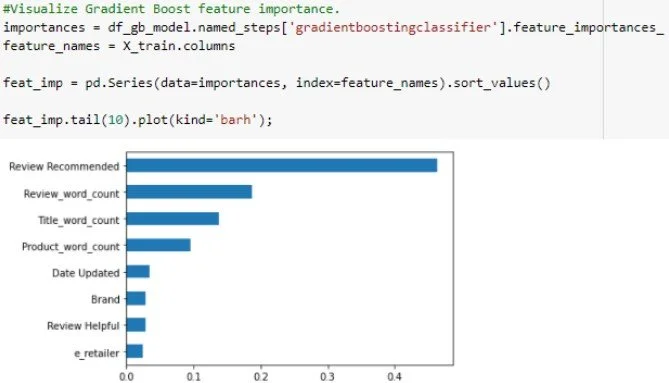
Diving in deeper, we see the Review Recommended feature has the largest weight on a product’s Rating.
At this point, I actually went back to confirm there was no data leakage. Due to the data types and mandatory/optional nature of the data, it was determined there was no leakage at an earlier stage in the process.
Confusion Matrix
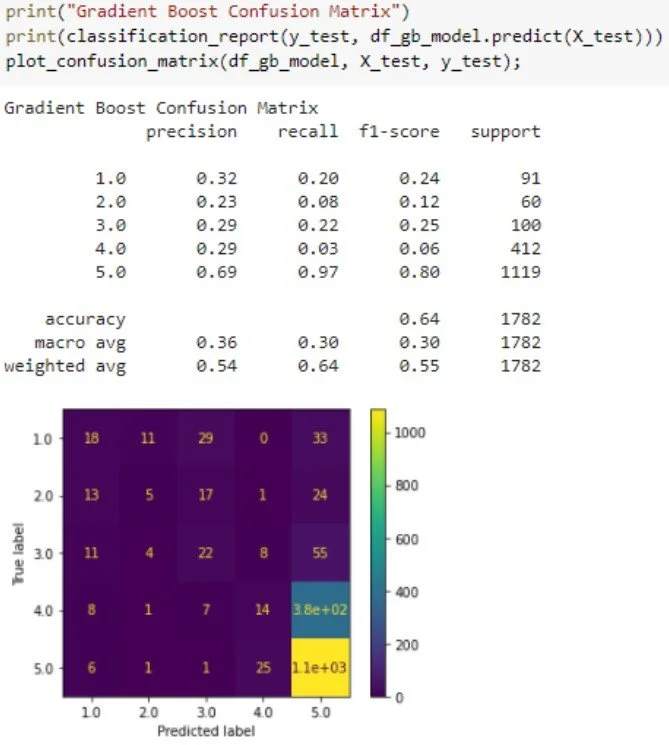
With the highest f1-score amongst the group, the Gradient Boosting model continued to prove the best fit for this data set and target. Within the confusion matrix, we can also see the similarities with the previous Rating histogram. The equivalent of the two very large bins on the histogram is the bright yellow and blue boxes within the confusion matrix.
Permuting
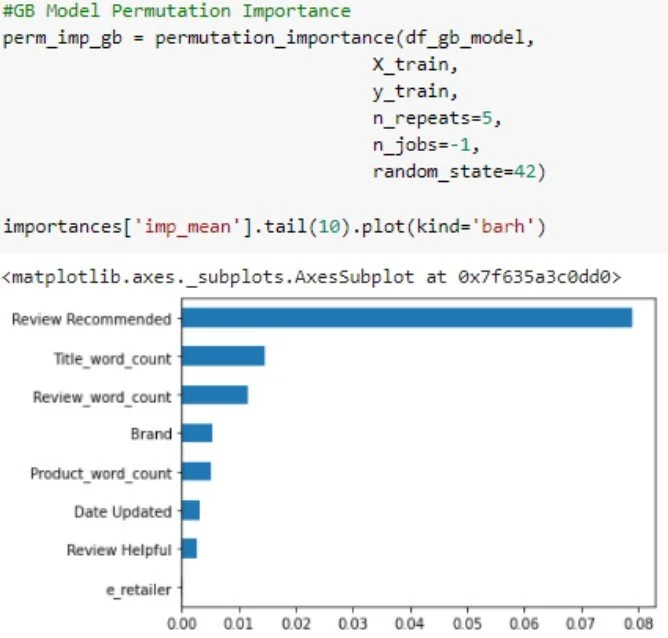
When looking at the features permutation importance we see a similar trend with some significantly subtle differences. In this view, the brand feature moved up two spaces. This is substantial because a significant portion of operating costs goes to the brand (marketing budget). Fully understanding this feature’s importance could provide annual budgeting guidance.

Conclusions
EDA | Modeling | Visualization | Conclusions | Further Reading
Considerations
Data
Data cleaning will always be a consideration until data science truly takes a respected foothold in corporate America. Incorporating a data engineer at the onset of data collection and creation could provide huge cost savings long term and quicker go-to-market insights.
As mentioned above, there are a few other features I would like to create for further exploration.
This data could have benefited from the inclusion of sales data. MSRP, discounts, wholesale, etc. The inclusion of this data could have provided valuable pricing strategy insights.
Technical
Pulling the retailer name out of the URL was a fun trick. Maybe this could be implemented into the data sources pulling methods for future implementation?
Additional visualizations were initially planned for this data set. However, due to the strong skew of this data, it proved a nice exercise for a later date.
Application
This data and project should not be directly applied to a real-world setting. While a neat exercise there are too many environmental variables not available within this data set.
To elaborate, this data covers electronics. All electronics. That is not just a purchase category like dairy, vegetables, or dry goods. It is an entire industry and requires a lot more data to accurately implement an effective model.
Conclusions
Gradient Boosting.
With the gradient boosting model we got a strong look into the importance of a feature to this target variable.
Review Recommended was the major influence on the Rating target. From here, I would reform my question to ask: what gets a review recommended? Switch Review Recommended to the target variable and continue to build upon these business insights.
Operations.
From this exercise, operations can see that features within their control, such as distribution and product word count, are not the largest factor to a product’s rating success.
To expand on these insights stakeholders can ask: Are these features that irrelevant to a rating that we do not need to invest as much time into it? Or, have we not invested enough time into these options and need to conduct a review?
This exercise proved that people do not only post reviews when they are negative. In fact, on the surface, this data set proved quite the opposite. To expand on these insights stakeholders could ask: what are the differences between service and product reviews? What are the differences between review websites and product sites with reviews?
Marketing.
This data can inform a marketing professional on social media and content tactics. Promoting review submissions and reusing them as testimonials could go a long way in toward product success.
A superfluous observation arose in this exercise that could prove informative for a product manager, media buyer, or ad network provider. Due to the data collection methods, it appears the same review could appear on multiple sites. This is good to know for reputation management, content efficiencies and

Keep Learning
IBM Cloud Learn Hub: Exploratory Data Analysis
Learn everything you need to know about exploratory data analysis, a method used to analyze and summarize data sets.
IBM Cloud Learn Hub: Supervised Learning
Learn how supervised learning works and how it can be used to build highly accurate machine learning models.
Qualtrics: Online Reviews Statistics to Know in 2021
93% of customers read online reviews before buying a product. Find out how to use online reviews to connect with your customers, improve your brand image and encourage positive buying recommendations.